Data Graphing Engine
A downloadable tool for Windows
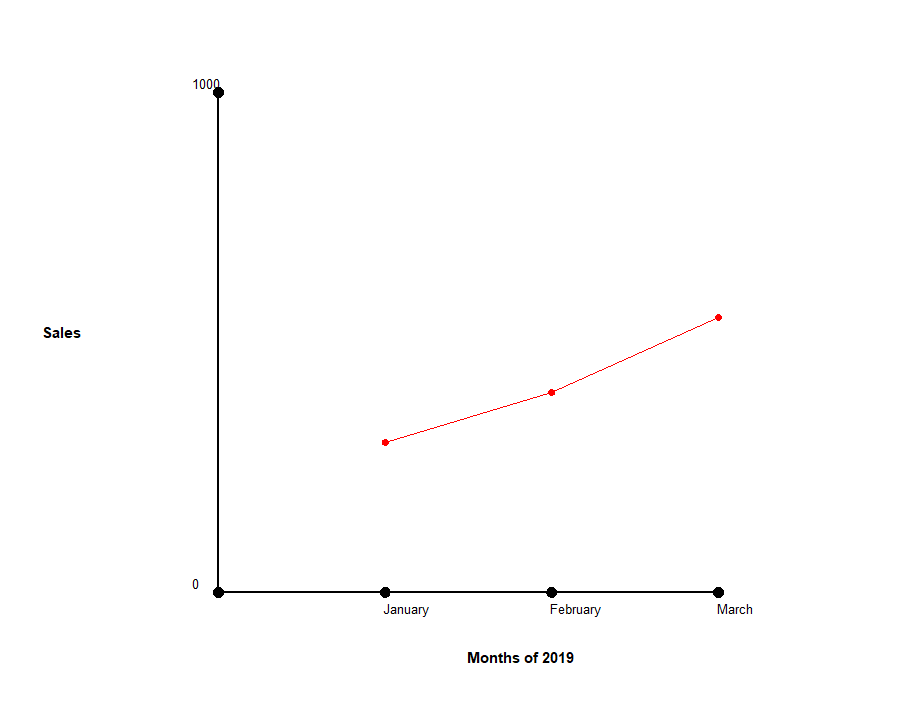
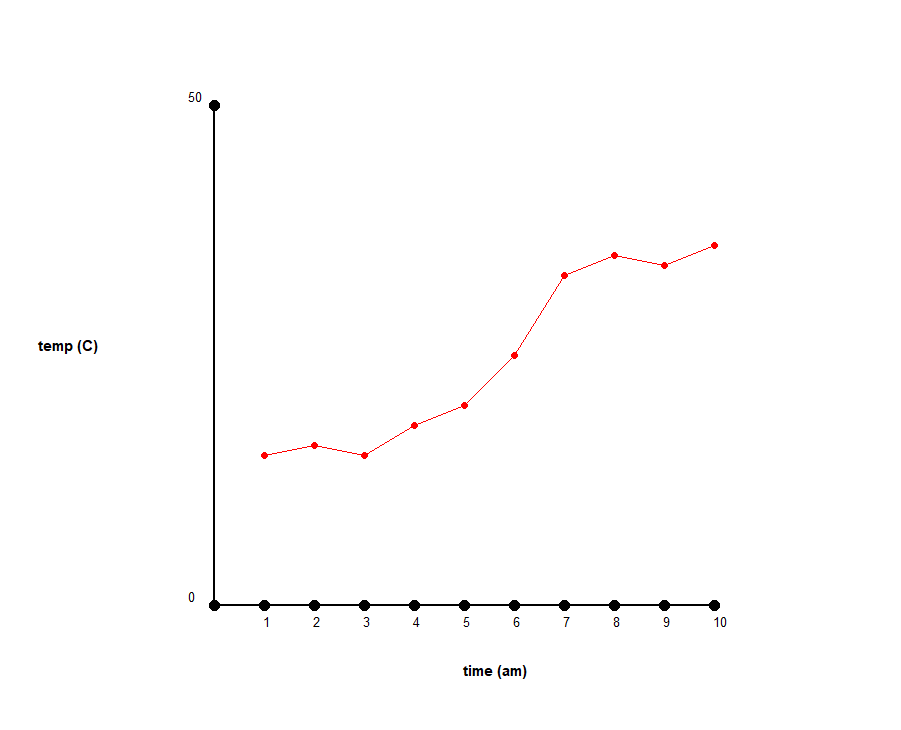
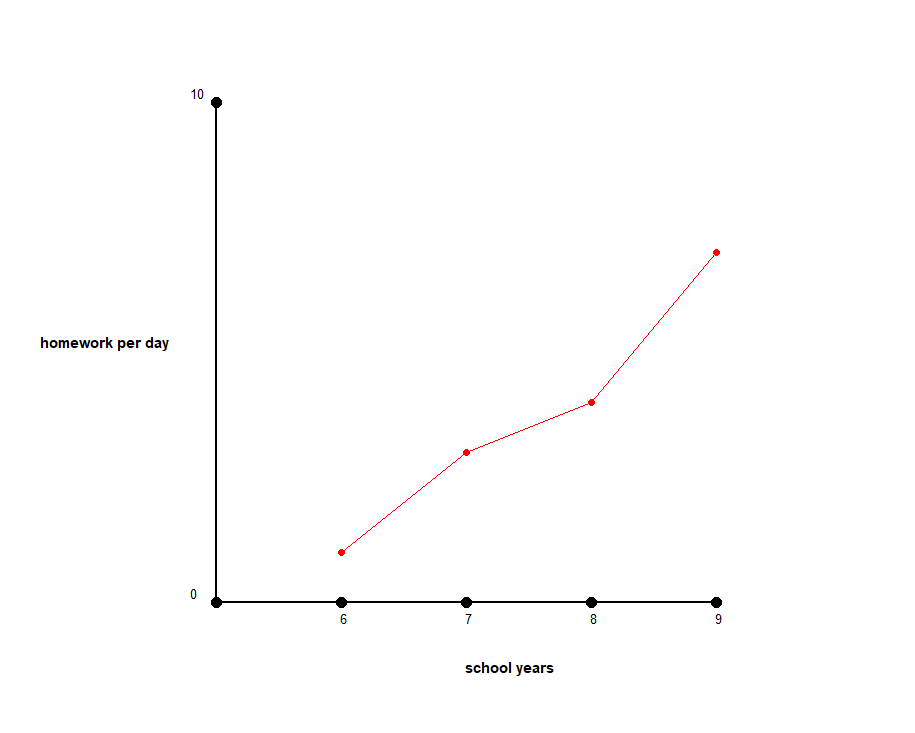
type up data into the terminal and this utility will draw up a line graph of the data you entered, useful analytics and data production. Will most probably receive updated versions in the future, including an option to enter your data in a GUI form rather than through a CLI, and an improved formatting system, as well as more things recommended by those who use it.
Download
Comments
Log in with itch.io to leave a comment.
Windows Antivirus may stop you from immediately running the file due to it being a .exe, or some browsers may warn you about it. This happens to all executable files and this is completely safe. If this happens to you, simply press "more info" and then "run anyway", or your browser will have the option to continue downloading.
HOW TO USE THE TOOL:
(all info included when executing, but here is some extra)
(make sure to resize graph window before inputting data, and this will update once you enter data)
1. enter the amount of items to appear on the X axis
2. look at the graph, and label the X item that is in red
3. continue step 2 until all X items are labelled
4. enter what the max value is of the Y axis, this will appear at the top of it
5. give the X axis a name
6. give the Y axis a name
7. look at the graph, an X item will be in red. Enter the value of this item
8. continue step 7 until all X items have a value
9. the graph has been drawn